If you need to upsize or you’re simply ready for a change, it’s tempting to consider a major renovation. After all, renovating means you don’t have to go through the process of selling your property and buying another more suitable home. You just fix up the one you’ve got!
However, you need to carefully consider the pros and cons of renovating before going this route. You don’t want to invest in a costly renovation only to end up with a home that still doesn’t meet your needs.
Say, for example, your current property doesn’t have a home office. Since all the bedrooms are taken, you decide to renovate a portion of the basement. Building that new home office may seem like a simple project, but once you consider new electrical, flooring, lighting, etc., it really isn’t. Like most renovations, it will probably cost more than you think. Plus, you’ll need to consider whether you’ll really want to work in the basement.
In this case, it might make more sense to find a new home with an extra bedroom that can be converted, or, better still, a dedicated home office space — with windows!
Of course, there are many circumstances in which a renovation may be the best way to go. If you don’t like your kitchen, for example, upgrading it may not only get you the kitchen you want, but also add value to your property.
Basically, you need to ask yourself: “Which is more likely to get me the home I really want – a renovation or a new home?”
If your answer is a new home, then there is probably a property on the market right now that would meet your needs. Let’s talk.
Buyer Demand Below Average in August
Home buyer demand stays below historical averages in August
The Metro Vancouver* housing market continues to experience reduced demand across all housing types.
The Real Estate Board of Greater Vancouver (REBGV) reports that residential home sales in the region totalled 1,929 in August 2018, a 36.6 per cent decrease from the 3,043 sales recorded in August 2017, and a 6.8 per cent decline compared to July 2018 when 2,070 homes sold.
Last month’s sales were 25.2 per cent below the 10-year August sales average.
“Home buyers have been less active in recent months and we’re beginning to see prices edge down for all housing types as a result,” Phil Moore, REBGV president said. “Buyers today have more listings to choose from and face less competition than we’ve seen in our market in recent years.”
There were 3,881 detached, attached and apartment homes newly listed for sale on the Multiple Listing Service® (MLS®) in Metro Vancouver in August 2018. This represents an 8.6 per cent decrease compared to the 4,245 homes listed in August 2017 and an 18.6 per cent decrease compared to July 2018 when 4,770 homes were listed.
The total number of homes currently listed for sale on the MLS® system in Metro Vancouver is 11,824, a 34.3 per cent increase compared to August 2017 (8,807) and a 2.6 per cent decrease compared to July 2018 (12,137).
The sales-to-active listings ratio for August 2018 is 16.3 per cent. By housing type, the ratio is 9.2 per cent for detached homes, 19.4 per cent for townhomes, and 26.6 per cent for apartments.
Generally, analysts say that downward pressure on home prices occurs when the ratio dips below the 12 per cent mark for a sustained period, while home prices often experience upward pressure when it surpasses 20 per cent over several months.
“With fewer buyers active in the market, benchmark prices across all three housing categories have declined for two consecutive months across the region,” Moore said.
The MLS® Home Price Index composite benchmark price for all residential properties in Metro Vancouver is currently $1,083,400. This represents a 4.1 per cent increase over August 2017 and a 1.9 per cent decrease since May 2018.
Sales of detached properties in August 2018 reached 567, a 37.1 per cent decrease from the 901 detached sales recorded in August 2017. The benchmark price for detached properties is $1,561,000. This represents a 3.1 per cent decrease from August 2017 and a 2.8 per cent decrease since May 2018.
Sales of apartment properties reached 1,025 in August 2018, 36.5 per cent decrease compared to the 1,613 sales in August 2017. The benchmark price of an apartment property is $695,500. This represents a 10.3 per cent increase from August 2017 and a 1.6 per cent decrease since May 2018.
Attached property sales in August 2018 totalled 337, a 36.3 per cent decrease compared to the 529 sales in August 2017. The benchmark price of an attached unit is $846,100. This represents a 7.9 per cent increase from August 2017 and a 0.8 per cent decrease since May 2018. If you have any questions on how to navigate today’s market, give me a call.
Housing supply up, demand down across Metro Vancouver
Housing supply up, demand down across Metro Vancouver
July’s residential housing sales in Metro Vancouver reached their lowest levels for that month since the year 2000.
The Real Estate Board of Greater Vancouver (REBGV) reports that residential property sales in the region totalled 2,070 in July 2018, a 30.1 per cent decrease from the 2,960 sales recorded in July 2017, and a decrease of 14.6 per cent compared to June 2018 when 2,425 homes sold.
Last month’s sales were 29.3 per cent below the 10-year July sales average.
“With fewer buyers active in today’s market, we’re seeing less upward pressure on home prices across the region,” Phil Moore, REBGV president said. “This is most pronounced in the detached home market, but demand in the townhome and apartment markets is also relenting from the more frenetic pace experienced over the last few years.”
There were 4,770 detached, attached and apartment properties newly listed for sale on the Multiple Listing Service® (MLS®) in Metro Vancouver in July 2018. This represents a 9.2 per cent decrease compared to the 5,256 homes listed in July 2017 and a 9.6 per cent decrease compared to June 2018 when 5,279 homes were listed.
The total number of properties currently listed for sale on the MLS® system in Metro Vancouver is 12,137, a 32 per cent increase compared to July 2017 (9,194) and a 1.6 per cent increase compared to June 2018 (11,947).
“Summer is traditionally a quieter time of year in real estate. This is particularly true this year,” Moore said. “With increased mortgage rates and stricter lending requirements, buyers and sellers are opting to take a wait-and-see approach for the time being.”
For all property types, the sales-to-active listings ratio for July 2018 is 17.1 per cent. By property type, the ratio is 9.9 per cent for detached homes, 20.2 per cent for townhomes, and 27.3 per cent for condominiums.
Generally, analysts say that downward pressure on home prices occurs when the ratio dips below the 12 per cent mark for a sustained period, while home prices often experience upward pressure when it surpasses 20 per cent over several months.
The MLS® Home Price Index composite benchmark price for all residential properties in Metro Vancouver is currently $1,087,500. This represents a 6.7 per cent increase over July 2017 and a 0.6 per cent decrease compared to June 2018.
Sales of detached properties in July 2018 reached 637, a decrease of 32.9 per cent from the 949 detached sales recorded in July 2017. The benchmark price for detached properties is $1,588,400. This represents a 1.5 per cent decrease from July 2017 and a 0.6 per cent decrease compared to June 2018.
Sales of apartment properties reached 1,079 in July 2018, a decrease of 26.5 per cent compared to the 1,468 sales in July 2017. The benchmark price of an apartment property is $700,500. This represents a 13.6 per cent increase from July 2017 and a 0.5 per cent decrease compared to June 2018.
Attached property sales in July 2018 totalled 354, a decrease of 34.8 per cent compared to the 543 sales in July 2017. The benchmark price of an attached unit is $856,000. This represents a 12.1 per cent increase from July 2017 and a 0.4 per cent decrease compared to June 2018.
Online shopping is growing by an average of 20 million new shoppers each year. That’s a lot of people clicking and buying! You may be one of them.
However, there’s a cost to online shopping that’s all too easy to overlook. Shipping fees. Imagine saving $10 on a luxury cookware set, only to be hit with a $15 delivery charge. Ouch.
So how do you avoid those fees?
First of all, always check the fine print on the checkout screen. Notice what the shipping cost (if any) will be before you click the final purchase button. Keep in mind that the base shipping fee shown may update — and become higher — once you’ve typed in your address.
Some e-tailers offer free delivery for orders over a certain threshold amount; for example, $50. If there’s more you can add to an order to get the shipping fee waived, it may be worth it.
There are a few e-tailers, most notably Amazon, that offer yearly memberships where one of the benefits is free delivery on all orders. Those kinds of memberships may be worth checking out if you do a lot of online shopping with a particular company.
A final tip:
Always check for multiple delivery options. Some e-tailers, list an express shipping charge as the default option on the check-out screen, but have a free standard delivery option if you choose it.
Takeaway:
Shipping fees take the fun out of online shopping. Do what you can to reduce or eliminate them!
Home seller supply grows as demand declines
Home seller supply grows as demand declines
With home sale activity dipping below long-term historical averages, the supply of homes for sale in Metro Vancouver reached a three-year high in June.
The Real Estate Board of Greater Vancouver (REBGV) reports that residential home sales in the region totalled 2,425 in June 2018, a 37.7 per cent decline from the 3,893 sales recorded in June 2017, and a 14.4 per cent decrease compared to May 2018 when 2,833 homes sold.
Last month’s sales were 28.7 per cent below the 10-year June sales average.
“Buyers are less active today. This is allowing the supply of homes for sale to accumulate to levels we haven’t seen in the last few years,” Phil Moore, REBGV president said. “Rising interest rates, high prices and more restrictive mortgage requirements are among the factors dampening home buyer activity today.”
There were 5,279 detached, attached and apartment properties newly listed for sale on the Multiple Listing Service® (MLS®) in Metro Vancouver in June 2018. This represents a 7.7 per cent decrease compared to the 5,721 homes listed in June 2017 and a 17.2 per cent decrease compared to May 2018 when 6,375 homes were listed.
The total number of homes currently listed for sale on the MLS® system in Metro Vancouver is 11,947, a 40.3 per cent increase compared to June 2017 (8,515) and a 5.8 per cent increase compared to May 2018 (11,292). This is the highest this total has been since June 2015.
“With reduced demand, detached homes are entering a buyers’ market and price growth in our townhome and apartment markets is showing signs of decelerating.”
For all property types, the sales-to-active listings ratio for June 2018 is 20.3 per cent. By property type, the ratio is 11.7 per cent for detached homes, 24.9 per cent for townhomes, and 33.4 per cent for condominiums.
Generally, analysts say that downward pressure on home prices occurs when the ratio dips below the 12 per cent mark for a sustained period, while home prices often experience upward pressure when it surpasses 20 per cent over several months.
The MLS® Home Price Index composite benchmark price for all residential properties in Metro Vancouver is currently $1,093,600. This represents a 9.5 per cent increase over June 2017 and is virtually unchanged from May 2018.
Sales of detached homes in June 2018 reached 766, a 42 per cent decrease from the 1,320 detached sales recorded in June 2017. The benchmark price for a detached home is $1,598,200. This represents a 0.7 per cent increase from June 2017 and a 0.6 per cent decrease compared to May 2018.
Sales of apartment homes reached 1,240 in June 2018, a 34.9 per cent decrease compared to the 1,905 sales in June 2017. The benchmark price for an apartment is $704,200. This represents a 17.2 per cent increase from June 2017 and a 0.4 per cent increase compared to May 2018.
Attached home sales in June 2018 totalled 419, a 37.3 per cent decrease compared to the 668 sales in June 2017. The benchmark price of an attached home is $859,800. This represents a 15.3 per cent increase from June 2017 and is virtually unchanged from May 2018.
Four Things You Should Know About Staging
Four Things You Should Know About Staging
You’ve probably heard about “home staging”. As the name implies, it’s all about arranging each room in your home in a way that will make the best impression on buyers. Here’s what you need to know about staging if you’re thinking of listing your property.
1. Staging can get you a higher price.
On average, a fully-staged home tends to sell for 17% more than an unstaged home of the same type in the same local market.
Depending on the current market value of your property, doing some staging in your home could put thousands of extra dollars in your pocket, post-sale.
2. It can speed up the sale.
A study by the Real Estate Staging Association (RESA) showed that fully- staged homes spend an average of 90% less time on the market. So, if you need to sell quickly – without dropping your price – or you just want the comfort of having offers come in sooner, staging will definitely help.
3. You don’t have to go crazy.
Completely staging every room in your home is going to give you the full benefits of this strategy. However, you don’t have to go that far. In fact, just implementing a few simple staging techniques to some key rooms can make a big difference.
4. Get professional help or advice.
When it comes to home staging, don’t guess at it. Get professional help or advice. As a REALTOR®, I have a lot of expertise in this area and often provide clients with proven, do-it-yourself staging tips and suggestions. If necessary, I can also recommend a professional stager. Please feel free to contact me anytime.
CRA Rules and Taxes
CRA Rules and Taxes
Did you know?
Most Canadians pay their fair share of taxes, says CRA, but the agency has detected some who are avoiding paying taxes related to real estate transactions.
According to CRA audits over the last three years, there have been “additional taxes related to the real estate sector,” to the tune of $592.6 million.
The agency says “buying a first home represents a great accomplishment” but that it’s committed to “taking concrete action against those who break the rules.”
QUICK TAX FACTS
Builders of new and substantially renovated residences or rental properties are required to collect and remit the GST/HST to CRA when they sell, rent out for the first time or appropriate the property for personal use. Additionally, purchasers of new residences must follow the rules when applying for new housing rebates.
Property flipping is not illegal, so Canadians have the right to purchase and sell property for a profit. However, the income resulting from these transactions is considered business income and must be reported.
If you have any questions about how the CRA rules affect the buying or selling of your home, give me a call and we can discuss the regulations.
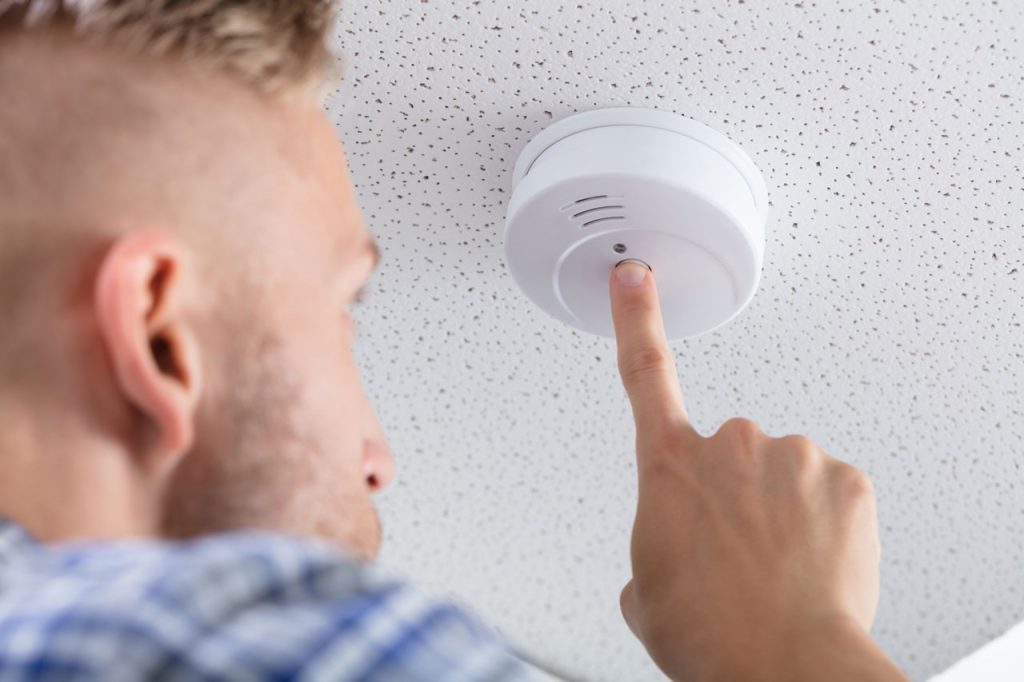
Carbon Monoxide (CO) is invisible and odourless, so you can’t actually “watch out for it”. However, you should monitor for it because an excessive build-up of this gas in your home can be deadly.
Fortunately, there are many types of Carbon Monoxide detectors you can purchase — and most are effective and affordable. Some models simply plug into an outlet. (Many also have a battery backup.)
Carbon Monoxide is caused by the incomplete burning of fuel. It can be released by a faulty gas furnace, kerosene heaters, and gas fireplaces. That’s why it’s a good idea to install detectors in areas close to these fixtures, as well as near bedrooms.
Experts say you should always follow manufacturer’s instructions when installing CO detectors and test them regularly. You want to make sure you can hear the alarm from your bedroom.
CO build-up in homes is rare. So your detectors may never go off. But, if the alarm does sound, get everyone (including pets) out of the home and into the fresh air. Then call 911. Typically, the fire department will do an inspection and determine the source of the carbon monoxide.
A final tip: Never use your BBQ or outside grill in the garage or, especially, anywhere inside your home. The risk of CO exposure is very high and definitely not worth the convenience of a grilled burger!
If you want to discuss ways to make your home even safer, give me a call and we can chat!
Reduced Demand is Allowing Housing Supply to Accumulate
Reduced demand is allowing housing supply to accumulate
Home buyer demand continues to decline across the Metro Vancouver housing market.
The Real Estate Board of Greater Vancouver (REBGV) reports that residential property sales in the region totalled 2,833 in May 2018, a 35.1 per cent decrease from the 4,364 sales recorded in May 2017, and a 9.8 per cent increase compared to April 2018 when 2,579 homes sold.
Last month’s sales were 19.3 per cent below the 10-year May sales average.
“With fewer homes selling today compared to recent years, the number of homes available for sale is rising,” Phil Moore, REBGV president said. “The selection of homes for sale in Metro Vancouver has risen to the highest levels we’ve seen in the last two years, yet supply is still below our long-term historical averages.”
There were 6,375 detached, attached and apartment properties newly listed for sale on the Multiple Listing Service® (MLS®) in Metro Vancouver in May 2018. This represents a 5.5 per cent increase compared to the 6,044 homes listed in May 2017 and a 9.5 per cent increase compared to April 2018 when 5,820 homes were listed.
The total number of properties currently listed for sale on the MLS® system in Metro Vancouver is 11,292, a 38.2 per cent increase compared to May 2017 (8,168) and a 15 per cent increase compared to April 2018 (9,822).
The total number of listings available today is 17.2 per cent below the 10-year May average.
For all property types, the sales-to-active listings ratio for May 2018 is 25.1 per cent. By property type, the ratio is 14.7 per cent for detached homes, 30.8 per cent for townhomes, and 41.7 per cent for condominiums.
Generally, analysts say that downward pressure on home prices occurs when the ratio dips below the 12 per cent mark for a sustained period, while home prices often experience upward pressure when it surpasses 20 per cent over several months.
“For home sellers to be successful in today’s market, it’s important to price your property competitively given the shifting dynamics we’re experiencing,” Moore said. “It’s also important to work with your local Realtor to better understand these changing conditions.”
The MLS® Home Price Index composite benchmark price for all residential properties in Metro Vancouver is currently $1,094,000. This is an 11.5 per cent increase over May 2017 and a 0.2 per cent increase compared to April 2018.
Sales of detached properties in May 2018 reached 926, a 40.2 per cent decrease from the 1,548 detached sales recorded in May 2017. The benchmark price for detached properties is $1,608,000. This is a 2.4 per cent increase from May 2017 and a 0.1 per cent increase compared to April 2018.
Sales of apartment properties reached 1,431 in May 2018, a 29.3 per cent decrease from the 2,025 sales in May 2017. The benchmark price of an apartment property is $701,700. This is a 20.2 per cent increase from May 2017 and a 0.1 per cent increase compared to April 2018.
Attached property sales in May 2018 totalled 476, a 39.8 per cent decrease from the 791 sales in May 2017. The benchmark price of an attached unit is $859,500. This represents a 16 per cent increase from May 2017 and a 0.6 per cent increase compared to April 2018.
If you have questions about how these changes might affect the selling of your home or buying a new one, give me a call and I’ll be happy to chat with you.
What Type of New Home Are You Qualified to Buy?
What Type of New Home Are You Qualified to Buy?
When you think about looking for a new home, one of the first questions that probably comes to mind is: “What type of property can I afford?” That’s an important question because your price range is a major determining factor in the types and sizes of homes you should be viewing.
You don’t want to waste time looking at properties that are beyond your price range. At the same time, you don’t want to purchase a less-than-ideal home, only to realize later on that you could have afforded more.
So how do you determine what type of new home you are qualified to purchase?
The first step is to find out what your current property would likely sell for in today’s market. I make that calculation for clients all the time. It involves reviewing what homes similar to yours have sold for recently, as well as other data — such as special features your home may have that are likely to boost the selling price.
Once you know the current market value of your home, subtract any outstanding mortgages and estimated selling expenses, and you’ll end up with an amount that can be applied to the purchase of your next home. (You may also have other funds you want to use.)
The next step is to talk to a lender or mortgage broker to see how much of a new mortgage you qualify for. (Call me if you need a recommendation.) It’s important to get a Pre-Qualification or Pre-Approval. That makes the offer you make on a new home more credible.
If you want to find out the types and sizes of homes you can get into, give me a call. I’d be happy to show you the possibilities!




 Did you know?