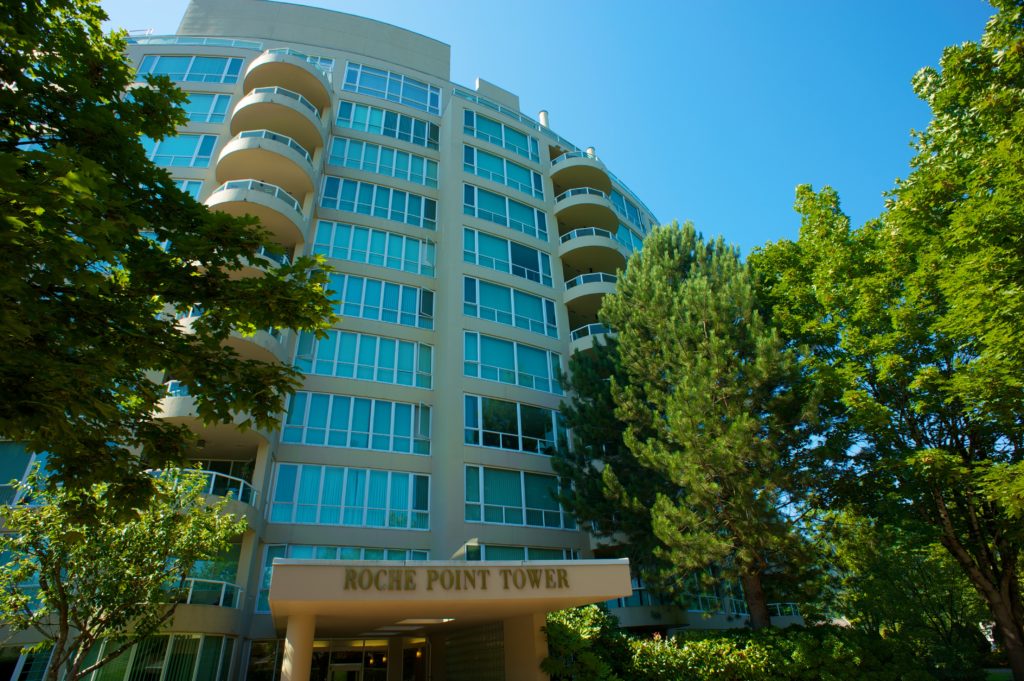
Competition for condominiums and townhomes pushed Metro Vancouver* home sales above typical levels in August.
The Real Estate Board of Greater Vancouver (REBGV) reports that residential property sales in the region totalled 3,043 in August 2017, a 22.3 per cent increase from the 2,489 sales recorded in August 2016, and a 2.8 per cent increase compared to July 2017 when 2,960 homes sold.
Last month’s sales were 19.6 per cent above the 10-year August sales average.
“First-time home buyers have led a surge this summer in demand in our condominium and townhome markets,” Jill Oudil, REBGV president said. “Homes priced between $350,000 and $750,000 have been subject to intense competition and multiple offers across the region.”
There were 4,245 detached, attached and apartment properties newly listed for sale on the Multiple Listing Service® (MLS®) in Metro Vancouver in August 2017. This represents a 1.1 per cent decrease compared to the 4,293 homes listed in August 2016 and a 19.2 per cent decrease compared to July 2017 when 5,256 homes were listed.
The total number of properties currently listed for sale on the MLS® system in Metro Vancouver is 8,807, a 3.5 per cent increase compared to August 2016 (8,506) and a 4.2 per cent decrease compared to July 2017 (9,194).
For all property types, the sales-to-active listings ratio for August 2017 is 34.6 per cent. By property type, the ratio is 16.3 per cent for detached homes, 44.8 per cent for townhomes, and 76.3 per cent for condominiums.
Generally, analysts say that downward pressure on home prices occurs when the ratio dips below 12 per cent for a sustained period, while home prices often experience upward pressure when it surpasses 20 per cent over several months.
“Conditions in our detached home market are distinct today from the dynamic in our condominium and townhome markets,” Oudil said. “Detached homes have entered a balanced market. This means there’s less upward pressure on prices and that buyers have more selection to choose from and more time to make their decisions.”
The MLS® Home Price Index composite benchmark price for all residential properties in Metro Vancouver is currently $1,029,700. This represents a 9.4 per cent increase over August 2016 and a one per cent increase compared to July 2017.
Sales of detached properties in August 2017 reached 901, a 26 per cent increase from the 715 detached sales recorded in August 2016. The benchmark price for detached properties is $1,615,100. This represents a 2.2 per cent increase from August 2016 and a 0.2 per cent increase compared to July 2017.
Sales of apartment properties reached 1,613 in August 2017, a 20.1 per cent increase compared to the 1,343 sales in August 2016. The benchmark price of an apartment property is $626,800. This represents a 19.4 per cent increase from August 2016 and a 1.7 per cent increase compared to July 2017.
Attached property sales in August 2017 totalled 529, a 22.7 per cent increase compared to the 431 sales in August 2016. The benchmark price of an attached unit is $778,300. This represents a 12.8 per cent increase from August 2016 and a 1.9 per cent increase compared to July 2017.
If you have any questions about that these REBGV statistics mean to you, give me a call.
Metro Vancouver sees fewer home sales and more listings in July
Metro Vancouver sees fewer home sales and more listings in July
Home buyer activity returned to more typical summer levels in Metro Vancouver last month.
The Real Estate Board of Greater Vancouver (REBGV) reports that residential property sales in the region totalled 2,960 in July 2017, an 8.2 per cent decrease from the 3,226 sales recorded in July 2016, and a decrease of 24 per cent compared to June 2017 when 3,893 homes sold.
Last month’s sales were 0.7 per cent above the 10-year July sales average.
“Housing demand is inconsistent across the region right now. Pockets of the market are still receiving multiple offers and others are not. It depends on price, property type, and location,” Jill Oudil, REBGV president said. “For example, it’s taking twice as long, on average, for a detached home to sell compared to both townhomes and condominiums.”
There were 5,256 detached, attached and apartment properties newly listed for sale on the Multiple Listing Service® (MLS®) in Metro Vancouver in July 2017. This represents a 0.3 per cent increase compared to the 5,241 homes listed in July 2016 and an 8.1 per cent decrease compared to June 2017 when 5,721 homes were listed.
The total number of properties currently listed for sale on the MLS® system in Metro Vancouver is 9,194, a 10.1 per cent increase compared to July 2016 (8,351) and an eight per cent increase compared to June 2017 (8,515).
“Because home sale activity decreased to more historically normal levels in July, the selection of homes for sale in the region was able to edge above 9,000 for the first time this year,” Oudil, said.
For all property types, the sales-to-active listings ratio for July 2017 is 32.2 per cent. By property type, the ratio is 16.9 per cent for detached homes, 44.9 per cent for townhomes, and 62 per cent for condominiums.
Generally, analysts say that downward pressure on home prices occurs when the ratio dips below the 12 per cent mark for a sustained period, while home prices often experience upward pressure when it surpasses 20 per cent over several months.
The MLS® Home Price Index composite benchmark price for all residential properties in Metro Vancouver is currently $1,019,400. This represents an 8.7 per cent increase over July 2016 and a 2.1 per cent increase compared to June 2017.
Sales of detached properties in July 2017 reached 949, a decrease of 11.9 per cent from the 1,077 detached sales recorded in July 2016. The benchmark price for detached properties is $1,612,400. This represents a 1.9 per cent increase from July 2016 and a 1.5 per cent increase compared to June 2017.
Sales of apartment properties reached 1,468 in July 2017, a decrease of 8.4 per cent compared to the 1,602 sales in July 2016. The benchmark price of an apartment property is $616,600. This represents an 18.5 per cent increase from July 2016 and a 2.7 per cent increase compared to June 2017.
Attached property sales in July 2017 totalled 543, a decrease of 0.7 per cent compared to the 547 sales in July 2016. The benchmark price of an attached unit is $763,700. This represents an 11.9 per cent increase from July 2016 and a 2.4 per cent increase compared to June 2017.
Do you have questions about the current market? Let me know and I can help decipher what today’s real estate market means for you as a buyer or seller.
Demand for condominiums continues to outstrip supply
Demand for Condos Continues
The imbalance between supply and demand in the condominium market is creating home buyer competition across Metro Vancouver.
The Real Estate Board of Greater Vancouver (REBGV) reports that residential property sales in the region totalled 3,893 in June 2017, an 11.5 per cent decrease from the 4,400 sales recorded in June 2016, an all-time record, and a decrease of 10.8 per cent compared to May 2017 when 4,364 homes sold.
Last month’s sales were 14.5 per cent above the 10-year June sales average.
“Two distinct markets have emerged this summer. The detached home market has seen demand ease back to more typical levels while competition for condominiums is creating multiple offer scenarios and putting upward pressure on prices for that property type,” Jill Oudil, REBGV president said.
There were 5,721 detached, attached and apartment properties newly listed for sale on the Multiple Listing Service® (MLS®) in Metro Vancouver in June 2017. This represents a 2.6 per cent decrease compared to the 5,875 homes listed in June 2016 and a 5.3 per cent decrease compared to May 2017 when 6,044 homes were listed.
The total number of properties currently listed for sale on the MLS® system in Metro Vancouver is 8,515, a nine per cent increase compared to June 2016 (7,812) and a 4.2 per cent increase compared to May 2017 (8,168).
“Home buyers have more selection to choose from in the detached market today while condominium listings are near an all-time low on the MLS®,” Oudil said. “Detached home listings have increased every month this year, while the number of condominiums for sale has decreased each month since February.”
For all property types, the sales-to-active listings ratio for June 2017 is 45.7 per cent. By property type, the ratio is 24.5 per cent for detached homes, 62 per cent for townhomes, and 93.2 per cent for condominiums.
Generally, analysts say that downward pressure on home prices occurs when the ratio dips below the 12 per cent mark for a sustained period, while home prices often experience upward pressure when it surpasses 20 per cent over several months.
“Market conditions will vary today depending on area and property type,” Oudil said. “It’s important to work with your local REALTOR® to help you understand the trends that are occurring in your community.”
The MLS® Home Price Index composite benchmark price for all residential properties in Metro Vancouver is currently $998,700. This represents a 7.9 per cent increase over June 2016 and a 1.8 per cent increase compared to May 2017.
Sales of detached properties in June 2017 reached 1,320, a decrease of 15.5 per cent from the 1,562 detached sales recorded in June 2016. The benchmark price for detached properties is $1,587,900. This represents a 1.4 per cent increase from June 2016 and a 1.1 per cent increase compared to May 2017.
Sales of apartment properties reached 1,905 in June 2017, a decrease of 9.6 per cent compared to the 2,108 sales in June 2016. The benchmark price of an apartment property is $600,700. This represents a 17.6 per cent increase from June 2016 and a 2.9 per cent increase compared to May 2017.
Attached property sales in June 2017 totalled 668, a decrease of 8.5 per cent compared to the 730 sales in June 2016. The benchmark price of an attached unit is $745,700. This represents a 10.7 per cent increase from June 2016 and a 0.6 per cent increase compared to May 2017.
If you have any questions about how the market affects your search, give me a call.
With files from the REBGV
REBGV Stats May 2017
Market activity picks up in May
Home buyer activity returned to near record levels across the Metro Vancouver housing market in May.
Residential property sales in the region totalled 4,364 in May 2017, a decrease of 8.5 per cent from the 4,769 sales in May 2016, an all-time record, and an increase of 22.8 per cent compared to April 2017 when 3,553 homes sold.
Last month’s sales were 23.7 per cent above the 10-year May sales average and is the third-highest selling May on record.
“Demand for condominiums and townhomes is driving today’s activity,” Jill Oudil, Real Estate Board of Greater Vancouver (REBGV) president said. “First-time buyers and people looking to downsize from their single-family homes are both competing for these two types of housing.”
New listings for detached, attached and apartment properties in Metro Vancouver totalled 6,044 in May 2017. This represents a 3.9 per cent decrease compared to the 6,289 units listed in May 2016 and a 23.2 per cent increase compared to April 2017 when 4,907 homes were listed.
The month-over-month increase in new listings was led by detached homes at 27.1 per cent, followed by apartments at 22.7 per cent and townhomes at 14.1 per cent.
The total number of properties currently listed for sale on the MLS® system in Metro Vancouver is 8,168, a 5.7 per cent increase compared to May 2016 (7,726) and a 4.5 per cent increase compared to April 2017 (7,813).
“Home buyers are beginning to have more selection to choose from in the detached market, but the number of condominiums for sale continues to decline,” Oudil said.
The sales-to-active listings ratio across all residential categories is 53.4 per cent. By property type, the ratio is 31 per cent for detached homes, 76.1 per cent for townhomes, and 94.6 per cent for condominiums.
Generally, analysts say that downward pressure on home prices occurs when the ratio dips below the 12 per cent mark for a sustained period, while home prices often experience upward pressure when it surpasses 20 per cent over several months.
“While sales are inching closer to the record-breaking pace of 2016, the market itself looks different. Sales last year were driven by demand for single-family homes. This year, it’s clear that townhomes and condominiums are leading the way,” said Oudil. “It’s important to work with your local REALTOR® to understand the different factors affecting the market today.”
The MLS® Home Price Index composite benchmark price for all residential properties in Metro Vancouver is currently $967,500. This represents an 8.8 per cent increase over May 2016 and a 2.8 per cent increase compared to April 2017.
Sales of detached properties in May 2017 reached 1,548, a decrease of 17 per cent from the 1,865 detached sales recorded in May 2016. The benchmark price for a detached property is $1,561,000. This represents a 3.1 per cent increase over May 2016 and a 2.9 per cent increase compared to April 2017.
Sales of apartment properties reached 2,025 in May 2017, a decrease of 5.8 per cent compared to the 2,150 sales in May 2016.The benchmark price for an apartment property is $571,300. This represents a 17.8 per cent increase over May 2016 and a 3.1 per cent increase compared to April 2017.
Attached property sales in May 2017 totalled 791, an increase of 4.9 per cent compared to the 754 sales in May 2016. The benchmark price for an attached property is $715,400. This represents a 13.1 per cent increase over May 2016 and a 1.9 per cent increase compared to April 2017.
Condominiums and townhomes in high demand across Metro Vancouver
Condominiums and townhomes in high demand across Metro Vancouver
Demand for condominiums and townhomes continues to drive the Metro Vancouver* housing market.
Residential property sales in the region totalled 3,553 in April 2017, a 25.7 per cent decline compared to April 2016 when 4,781 homes sold and a 0.7 percent decrease from the 3,579 sales recorded in March 2017.
April sales were 4.8 per cent above the 10-year average for the month.
For the first four months of the year, condominium and townhome sales have comprised a larger percentage of all residential sales on the Multiple Listing Service® (MLS®) in Metro Vancouver. Over this time, they’ve accounted for 68.5 percent, on average, of all residential sales. This is up 10 percent from the 58.2 per cent average over the same period last year.
“Our overall market is operating below the record-setting pace from a year ago and is in line with historical spring levels. It’s a different story in our condominium and townhome markets,” Jill Oudil, Real Estate Board of Greater Vancouver (REBGV) president said. “Demand has been increasing for months and supply is not keeping pace. This dynamic is causing prices to increase and making multiple offer scenarios the norm.”
New listings for detached, attached and apartment properties in Metro Vancouver totalled 4,907 in April 2017. This represents a decrease of 19.9 percent compared to the 6,127 units listed in April 2016 and a three per cent increase compared to March 2017 when 4,762 properties were listed.
The total number of residential properties currently listed for sale on the MLS® system in Metro Vancouver is 7,813, a 3.5 percent increase compared to April 2016 (7,550) and a three per cent increase compared to March 2017 (7,586).
The sales-to-active listings ratio for April 2017 is 45.5 per cent for all property types. This is two percent below March 2017 and is indicative of a sellers’ market. Generally, analysts say that downward pressure on home prices occurs when the ratio dips below the 12 per cent mark for a sustained period, while home prices often experience upward pressure when it surpasses 20 per cent over several months.
By property type, the sales-to-active listings ratio is 26 percent for detached homes, 58.2 percent for townhomes, and 82.2 per cent for condominiums.
“Until more entry level, or ‘missing middle’, homes are available for sale in our market, we’ll likely continue to see prices increase,” Oudil said. “There’s been record building this past year, but much of that inventory isn’t ready to hit the market.”
The MLS® Home Price Index composite benchmark price for all residential properties in Metro Vancouver is currently $941,100. This represents a five per cent increase over the past three months and an 11.4 percent increase compared to April 2016.
Over the last three months, the benchmark price of condominiums has seen the largest increase in the region at 8.2 percent, followed by townhomes at 5.3 per cent, and detached homes at 2.8 percent.
“Home buyers are looking to get into the market and they’re facing fierce competition,” Oudil said. “It’s important to work with your local Realtor to help you navigate today’s marketplace.”
Sales of detached properties in April 2017 reached 1,211, a decrease of 38.8 percent from the 1,979 detached sales recorded in April 2016. The benchmark price for detached properties is $1,516,500. This represents an 8.1 percent increase over the last 12 months and a 1.8 percent increase compared to March 2017.
Sales of apartment, or condominium, properties reached 1,722 in April 2017, a decrease of 18.3 percent compared to the 2,107 sales in April 2016.The benchmark price of an apartment property is $554,100. This represents a 16.6 percent increase over the past 12 months and a 3.1 percent increase compared to March 2017.
Attached, or townhome, property sales in April 2017 totalled 620, a decrease of 10.8 percent compared to the 695 sales in April 2016. The benchmark price of an attached unit is $701,800. This represents a 15.3 percent increase over the past 12 months and a 2.4 percent increase compared to March 2017.