Demand for condominiums continues to outstrip supply
Demand for Condos Continues
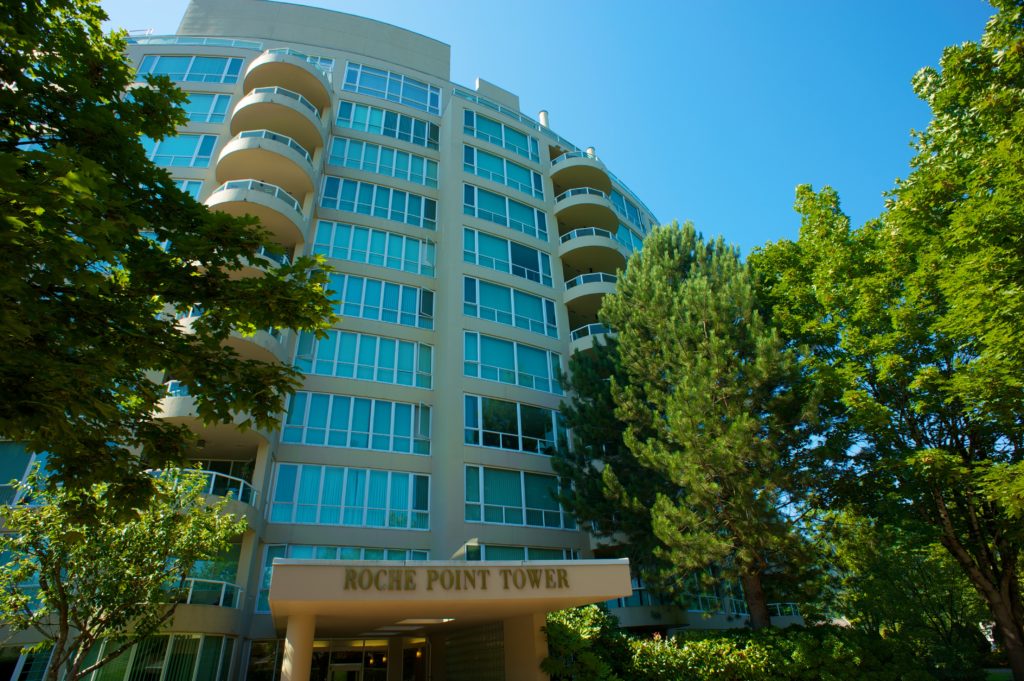
The imbalance between supply and demand in the condominium market is creating home buyer competition across Metro Vancouver.
The Real Estate Board of Greater Vancouver (REBGV) reports that residential property sales in the region totalled 3,893 in June 2017, an 11.5 per cent decrease from the 4,400 sales recorded in June 2016, an all-time record, and a decrease of 10.8 per cent compared to May 2017 when 4,364 homes sold.
Last month’s sales were 14.5 per cent above the 10-year June sales average.
“Two distinct markets have emerged this summer. The detached home market has seen demand ease back to more typical levels while competition for condominiums is creating multiple offer scenarios and putting upward pressure on prices for that property type,” Jill Oudil, REBGV president said.
There were 5,721 detached, attached and apartment properties newly listed for sale on the Multiple Listing Service® (MLS®) in Metro Vancouver in June 2017. This represents a 2.6 per cent decrease compared to the 5,875 homes listed in June 2016 and a 5.3 per cent decrease compared to May 2017 when 6,044 homes were listed.
The total number of properties currently listed for sale on the MLS® system in Metro Vancouver is 8,515, a nine per cent increase compared to June 2016 (7,812) and a 4.2 per cent increase compared to May 2017 (8,168).
“Home buyers have more selection to choose from in the detached market today while condominium listings are near an all-time low on the MLS®,” Oudil said. “Detached home listings have increased every month this year, while the number of condominiums for sale has decreased each month since February.”
For all property types, the sales-to-active listings ratio for June 2017 is 45.7 per cent. By property type, the ratio is 24.5 per cent for detached homes, 62 per cent for townhomes, and 93.2 per cent for condominiums.
Generally, analysts say that downward pressure on home prices occurs when the ratio dips below the 12 per cent mark for a sustained period, while home prices often experience upward pressure when it surpasses 20 per cent over several months.
“Market conditions will vary today depending on area and property type,” Oudil said. “It’s important to work with your local REALTOR® to help you understand the trends that are occurring in your community.”
The MLS® Home Price Index composite benchmark price for all residential properties in Metro Vancouver is currently $998,700. This represents a 7.9 per cent increase over June 2016 and a 1.8 per cent increase compared to May 2017.
Sales of detached properties in June 2017 reached 1,320, a decrease of 15.5 per cent from the 1,562 detached sales recorded in June 2016. The benchmark price for detached properties is $1,587,900. This represents a 1.4 per cent increase from June 2016 and a 1.1 per cent increase compared to May 2017.
Sales of apartment properties reached 1,905 in June 2017, a decrease of 9.6 per cent compared to the 2,108 sales in June 2016. The benchmark price of an apartment property is $600,700. This represents a 17.6 per cent increase from June 2016 and a 2.9 per cent increase compared to May 2017.
Attached property sales in June 2017 totalled 668, a decrease of 8.5 per cent compared to the 730 sales in June 2016. The benchmark price of an attached unit is $745,700. This represents a 10.7 per cent increase from June 2016 and a 0.6 per cent increase compared to May 2017.
If you have any questions about how the market affects your search, give me a call.
With files from the REBGV
How to Find a Home you Love
No Homes for Sale in the Area You Like? Here’s What to Do…
Imagine there’s a neighbourhood you’d love to live in someday, but, every time you drive through, you rarely, if ever, see a For Sale sign. It’s as if homes get gobbled up by buyers the moment they get listed.
It’s true, properties do tend to sell quickly in desirable, in-demand neighbourhoods. Does that mean you’re destined to either hope for a lucky break or miss out on ever living there?
Fortunately, no. There are practical things you can do to increase your chances of getting into that neighbourhood.
Your first step is to find out the kind of new home you can afford. You want to get your financial ducks in a row so when a listing does come up in the area, you’re able to respond quickly. Find out the average price range of homes in the neighbourhood. Then, if necessary, talk to your lender or mortgage broker.
The second step is to get your current property ready for sale. You don’t necessarily need to list it now, but you want to be in a position to do so quickly, if necessary. You may need to clean up and declutter, get repairs done, and spruce up your home in other ways.
You see, listings in popular neighbourhoods often move fast. By the time you see them advertised on the internet, they may be gone. I can closely monitor listings in that area for you, so the moment one comes up that meets your criteria, you can be alerted. This greatly increases your chances of getting that home.
So if there is a dream neighbourhood you’d love to get into, give me a call.
Going “Green” in Your Garden or Flower Bed
Going “Green” in Your Garden or Flower Bed
There has been a lot of emphasis lately on the importance of “going green”. That simply means being environmentally-responsible. You likely already recycle, use energy-efficient lights, and turn down your thermostat when no one is home.
Yet, most of us don’t think about the garden or flower bed when we “think green”.
We should. Here are a few practical things you can do to tend to outdoor plants — without negatively impacting the environment.
Pull weeds instead of using a weed killer.
Avoid strong pesticides. (Products that target only one or two types of insects tend to be less harsh.)
Don’t use flower bed ornaments (i.e. gnomes) that might bleed colour dye into the soil. (Ask your garden centre before you buy.)
Be careful not to leave hand spades, trowels, and other garden tools lying around, especially over winter. They can rust, which contaminates the soil.
These tips may seem minor, but if you want to be environmentally conscious, every little bit helps! Let me know how I can further advise you.
Handling a New Home Problem on Moving Day
Handling a New Home Problem on Moving Day
Imagine buying a product from a store, taking it home, and then discovering there’s a problem with it. Disappointing, yes, but not a catastrophe. You can simply take it back for repair or exchange.
But, what if it’s moving day, and you discover there’s a problem with your new home? Whoa. A house isn’t so easily returned!
What are the most common problems encountered on moving day?
A delay in getting the keys.
The seller not having completely moved out.
An item expected to be included with the property is missing. (For example, the window blinds.)
Something needs repair that was not disclosed by the seller, nor did it come up during inspection. (For example, the dishwasher not working.)
Damage to the property caused by the seller. (For example, a heavy item dropped during the move and cracking a floor tile.)
Fortunately, these are rare events and I do everything I can to make sure everything is 100% correct. In most cases, you can expect no serious issues when you move into your new home.
But, if something is wrong, you have options. So, call me immediately. In all likelihood, I will be able to quickly resolve the issue.
If it’s a serious matter, such as missing items, I may get your real estate lawyer involved to arrange for the return of the item(s) or compensation.
So don’t worry. Let the professionals handle it. You can just enjoy your new home!
REBGV Stats May 2017
Market activity picks up in May
Home buyer activity returned to near record levels across the Metro Vancouver housing market in May.
Residential property sales in the region totalled 4,364 in May 2017, a decrease of 8.5 per cent from the 4,769 sales in May 2016, an all-time record, and an increase of 22.8 per cent compared to April 2017 when 3,553 homes sold.
Last month’s sales were 23.7 per cent above the 10-year May sales average and is the third-highest selling May on record.
“Demand for condominiums and townhomes is driving today’s activity,” Jill Oudil, Real Estate Board of Greater Vancouver (REBGV) president said. “First-time buyers and people looking to downsize from their single-family homes are both competing for these two types of housing.”
New listings for detached, attached and apartment properties in Metro Vancouver totalled 6,044 in May 2017. This represents a 3.9 per cent decrease compared to the 6,289 units listed in May 2016 and a 23.2 per cent increase compared to April 2017 when 4,907 homes were listed.
The month-over-month increase in new listings was led by detached homes at 27.1 per cent, followed by apartments at 22.7 per cent and townhomes at 14.1 per cent.
The total number of properties currently listed for sale on the MLS® system in Metro Vancouver is 8,168, a 5.7 per cent increase compared to May 2016 (7,726) and a 4.5 per cent increase compared to April 2017 (7,813).
“Home buyers are beginning to have more selection to choose from in the detached market, but the number of condominiums for sale continues to decline,” Oudil said.
The sales-to-active listings ratio across all residential categories is 53.4 per cent. By property type, the ratio is 31 per cent for detached homes, 76.1 per cent for townhomes, and 94.6 per cent for condominiums.
Generally, analysts say that downward pressure on home prices occurs when the ratio dips below the 12 per cent mark for a sustained period, while home prices often experience upward pressure when it surpasses 20 per cent over several months.
“While sales are inching closer to the record-breaking pace of 2016, the market itself looks different. Sales last year were driven by demand for single-family homes. This year, it’s clear that townhomes and condominiums are leading the way,” said Oudil. “It’s important to work with your local REALTOR® to understand the different factors affecting the market today.”
The MLS® Home Price Index composite benchmark price for all residential properties in Metro Vancouver is currently $967,500. This represents an 8.8 per cent increase over May 2016 and a 2.8 per cent increase compared to April 2017.
Sales of detached properties in May 2017 reached 1,548, a decrease of 17 per cent from the 1,865 detached sales recorded in May 2016. The benchmark price for a detached property is $1,561,000. This represents a 3.1 per cent increase over May 2016 and a 2.9 per cent increase compared to April 2017.
Sales of apartment properties reached 2,025 in May 2017, a decrease of 5.8 per cent compared to the 2,150 sales in May 2016.The benchmark price for an apartment property is $571,300. This represents a 17.8 per cent increase over May 2016 and a 3.1 per cent increase compared to April 2017.
Attached property sales in May 2017 totalled 791, an increase of 4.9 per cent compared to the 754 sales in May 2016. The benchmark price for an attached property is $715,400. This represents a 13.1 per cent increase over May 2016 and a 1.9 per cent increase compared to April 2017.
Does Your Home Insurance Cover Everything?
Does Your Home Insurance Cover Everything?
When you suffer damage to (or the loss of) your home or its contents, you expect your insurance company to help you out. And, most do a good job of doing just that.
Still, it’s a good idea to review your policy with your insurance advisor and find out what’s covered and what isn’t. You don’t want to discover that your policy will not cover the cost of repairing the damage caused by a flood in your laundry room.
Pay particular attention to coverage in the case of water damage. Some insurance policies don’t cover floods and sewer backup unless an additional rider is purchased.
Also, check liability limits. Ask your advisor to recommend an appropriate level. Finally, make sure you know exactly how much your home is insured for. Are you covered for the full replacement cost? Are you comfortable with that coverage or the actual cash value?
Having the right insurance gives you peace-of-mind and is an important part of enjoying your home.
Keep in mind that experts advise you to review your insurance with your advisor. Ask lots of questions. Make sure you understand your coverage fully.
By the way, if you’re looking for an insurance advisor, I’m well-connected in the local “home” industry. I may be able to give you a couple of names of good, reputable professionals. Give me a call.
Buying Your Dream Home in a Hot Market
Buying Your Dream Home in a Hot Market
Imagine finding the perfect home, only to discover there is serious interest from at least a dozen other buyers. It’s like scrambling for the last piece of cake at a buffet!
Fortunately, there are things you can do to help get the home you want, even in a highly competitive market.
Here are just a few ideas for Buying Your Dream Home in a Hot Market:
Only view a few ideal properties at a time. If you see too many, and thus spread yourself too thin, you risk homes slipping through your fingers.
Be realistic about price. Focus on finding a great home that you can afford, rather than trying to find a bargain.
Consider homes that need some work. They get less interest than perfectly staged properties, yet can turn out to be a dream home.
Be prepared to make an offer with as few conditions as possible. An offer conditional on passing inspection is usually fine, but in a competitive situation, offers with other conditions will likely be turned down flat.
Make your decisions quickly. If there are likely to be other interested buyers, you want to get your offer in early.
Make the right offer. To win the deal, you want your offer to be as enticing as possible to the seller — especially when it comes to price.
Yes, it can be tough finding an ideal home in a hot market, but I can help. Give me a call and I’ll show you how.
Condominiums and townhomes in high demand across Metro Vancouver
Condominiums and townhomes in high demand across Metro Vancouver
Demand for condominiums and townhomes continues to drive the Metro Vancouver* housing market.
Residential property sales in the region totalled 3,553 in April 2017, a 25.7 per cent decline compared to April 2016 when 4,781 homes sold and a 0.7 percent decrease from the 3,579 sales recorded in March 2017.
April sales were 4.8 per cent above the 10-year average for the month.
For the first four months of the year, condominium and townhome sales have comprised a larger percentage of all residential sales on the Multiple Listing Service® (MLS®) in Metro Vancouver. Over this time, they’ve accounted for 68.5 percent, on average, of all residential sales. This is up 10 percent from the 58.2 per cent average over the same period last year.
“Our overall market is operating below the record-setting pace from a year ago and is in line with historical spring levels. It’s a different story in our condominium and townhome markets,” Jill Oudil, Real Estate Board of Greater Vancouver (REBGV) president said. “Demand has been increasing for months and supply is not keeping pace. This dynamic is causing prices to increase and making multiple offer scenarios the norm.”
New listings for detached, attached and apartment properties in Metro Vancouver totalled 4,907 in April 2017. This represents a decrease of 19.9 percent compared to the 6,127 units listed in April 2016 and a three per cent increase compared to March 2017 when 4,762 properties were listed.
The total number of residential properties currently listed for sale on the MLS® system in Metro Vancouver is 7,813, a 3.5 percent increase compared to April 2016 (7,550) and a three per cent increase compared to March 2017 (7,586).
The sales-to-active listings ratio for April 2017 is 45.5 per cent for all property types. This is two percent below March 2017 and is indicative of a sellers’ market. Generally, analysts say that downward pressure on home prices occurs when the ratio dips below the 12 per cent mark for a sustained period, while home prices often experience upward pressure when it surpasses 20 per cent over several months.
By property type, the sales-to-active listings ratio is 26 percent for detached homes, 58.2 percent for townhomes, and 82.2 per cent for condominiums.
“Until more entry level, or ‘missing middle’, homes are available for sale in our market, we’ll likely continue to see prices increase,” Oudil said. “There’s been record building this past year, but much of that inventory isn’t ready to hit the market.”
The MLS® Home Price Index composite benchmark price for all residential properties in Metro Vancouver is currently $941,100. This represents a five per cent increase over the past three months and an 11.4 percent increase compared to April 2016.
Over the last three months, the benchmark price of condominiums has seen the largest increase in the region at 8.2 percent, followed by townhomes at 5.3 per cent, and detached homes at 2.8 percent.
“Home buyers are looking to get into the market and they’re facing fierce competition,” Oudil said. “It’s important to work with your local Realtor to help you navigate today’s marketplace.”
Sales of detached properties in April 2017 reached 1,211, a decrease of 38.8 percent from the 1,979 detached sales recorded in April 2016. The benchmark price for detached properties is $1,516,500. This represents an 8.1 percent increase over the last 12 months and a 1.8 percent increase compared to March 2017.
Sales of apartment, or condominium, properties reached 1,722 in April 2017, a decrease of 18.3 percent compared to the 2,107 sales in April 2016.The benchmark price of an apartment property is $554,100. This represents a 16.6 percent increase over the past 12 months and a 3.1 percent increase compared to March 2017.
Attached, or townhome, property sales in April 2017 totalled 620, a decrease of 10.8 percent compared to the 695 sales in April 2016. The benchmark price of an attached unit is $701,800. This represents a 15.3 percent increase over the past 12 months and a 2.4 percent increase compared to March 2017.
The Magic of Decorative Moulding
The Magic of Decorative Moulding
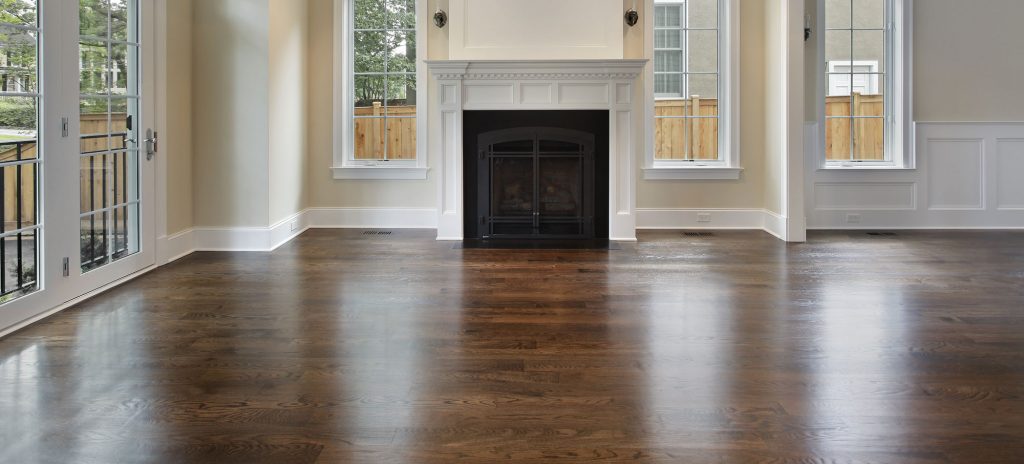
Decorative moulding is one of the most eye-catching ways to upgrade a room. You’re probably accustomed to seeing standard baseboard moulding installed where your floor meets the wall. But, there are many other types. For example:
Crown moulding for ceilings.
Panel moulding for a southern colonial look.
Chair rail moulding, which is very distinctive on walls.
Apron moulding for window sills.
Entablature moulding for above doorways.Decorative moulding comes in a dizzying array of styles. Interior designers recommend taking home samples, just as you would take paint swatches, to test out ideas.In addition to style choices, you also need to select the material you prefer. Moulding can be made of wood, plaster, laminate, composite, fiberboard, vinyl and other materials. There are pros and cons to each. Generally, the higher-priced options are more attractive and durable. (If you select wood, you typically have the additional option of “finished or unfinished”. If you choose unfinished, you of course, will be painting it yourself.)Choosing the right moulding for the look you want is the toughest part of the job. Installation is a lot easier and most people with DIY experience have no problems.So if you want to add some magic to your walls, consider decorative moulding. It can turn a room from standard to stunning.Let me know if I can help you when planning some finishing touches to your home.
Demand Outpaces Supply
Demand for homes continues to outpace supply in Metro Vancouver
A shortage of residential property listings coupled with strong demand, particularly for condos and townhomes, continued to impact Metro Vancouver’s housing market in March.
Residential property sales in the region totalled 3,579 in March 2017, a decrease of 30.8 percent from the 5,173 sales recorded in record-breaking March 2016 and an increase of 47.6 percent compared to February 2017 when 2,425 homes sold.
Last month’s sales were 7.9 per cent above the 10-year sales average for the month.
“While demand in March was below the record high of last year, we saw demand increase month-to-month for condos and townhomes,” Jill Oudil, Real Estate Board of Greater Vancouver (REBGV) president said. “Sellers still seem reluctant to put their homes on the market, making for stiff competition among home buyers.”
New listings for detached, attached and apartment properties in Metro Vancouver totalled 4,762 in March 2017. This represents a decrease of 24.1 percent compared to the 6,278 units listed in March 2016 and a 29.9 per cent increase compared to February 2017 when 3,666 properties were listed.
This is the lowest number of new listings in March since 2009.
The total number of properties currently listed for sale on the MLS® system in Metro Vancouver is 7,586, a 3.1 percent increase compared to March 2016 (7,358) and a 0.1 percent decrease compared to February 2017 (7,594).
The sales-to-active listings ratio for March 2017 is 47.2 percent, a 15-point increase over February. Generally, analysts say that downward pressure on home prices occurs when the ratio dips below the 12 per cent mark for a sustained period, while home prices often experience upward pressure when it surpasses 20 percent over several months.
“Home prices will likely continue to increase until we see more housing supply coming on to the market,” Oudil said.
The MLS® Home Price Index composite benchmark price for all residential properties in Metro Vancouver is currently $919,300. This represents a 0.8 percent decrease over the past six months and a 1.4 percent increase compared to February 2017.
Sales of detached properties in March 2017 reached 1,150, a decrease of 46.1 percent from the 2,135 detached sales recorded in March 2016. The benchmark price for detached properties is $1,489,400. This represents a 5.0 percent decrease over the past six months and a one per cent increase compared to February 2017.
Sales of apartment properties reached 1,841 in March 2017, a decrease of 18.3 percent compared to the 2,252 sales in March 2016.The benchmark price of an apartment property is $537,400. This represents a 5.2 percent increase over the past six months and a 2.1 percent increase compared to February 2017.
Attached property sales in March 2017 totalled 588, a decrease of 25.2 percent compared to the 786 sales in March 2016. The benchmark price of an attached unit is $685,100. This represents a 1.3 percent increase over the past six months and a 1.4 percent increase compared to February 2017.
If you have any questions about what the current market means for you, give me a call.




 When you suffer damage to (or the loss of) your home or its contents, you expect your insurance company to help you out. And, most do a good job of doing just that.
 Imagine finding the perfect home, only to discover there is serious interest from at least a dozen other buyers. It’s like scrambling for the last piece of cake at a buffet!