Should You Rent Out Part of Your Home?
Should You Rent Out Part of Your Home?
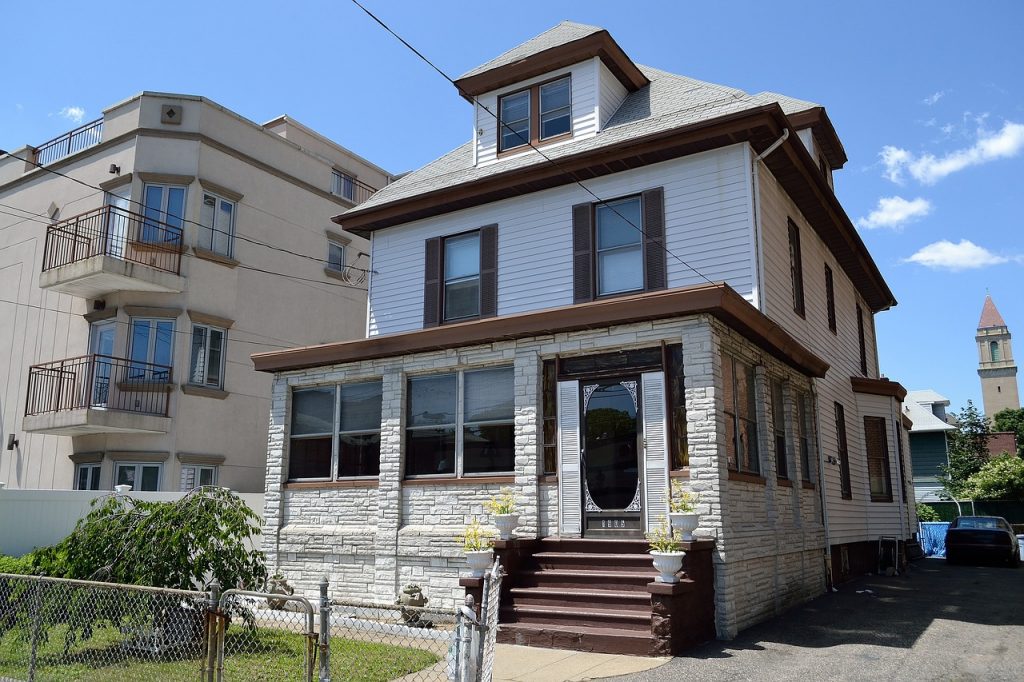 Have you ever considered renting out a room to a student or renovating your basement into a self-contained rental apartment?
It’s a big decision. There are many pros and cons to consider.
On the pro side, renting can provide you with additional income. An extra few hundred dollars a month can go a long way towards paying down your mortgage or splurging on an exotic summer vacation.
Creating rentable living space in your home — for example, an “in-law suite” featuring a kitchenette and bathroom — may also increase your property’s market value.
On the con side, you’ll have more costs and responsibilities as a landlord. For example, you might need to purchase extra insurance because basic home insurance policies typically do not cover rental units, even if you’re just renting out a room. You’ll also be responsible for dealing with repairs sometimes in the middle of the night.
Also, if you’re not careful about the renter you choose, you might end up with a “problem tenant”. For example, you could have a tenant who is consistently late on rent payments or simply stops paying. That can be stressful.
If you’re deciding whether or not to rent, be sure to check local laws and regulations. Many jurisdictions have very strict rules regarding renting out space in a residential property, and those rules change frequently. Make sure you get the latest information. Let me know if you need help sorting through the regulations.
Overview of the 2017 Vancouver Housing Market

Steady sales and diminished listings characterize 2017 for the Metro Vancouver housing market
After reaching record levels in 2015 and 2016, Metro Vancouver home sales returned to more historically normal levels in 2017. Home listings, on the other hand, came in several thousand units below typical activity.
The Real Estate Board of Greater Vancouver (REBGV) reports that sales of detached, attached and apartment properties reached 35,993 on the Multiple Listing Service® (MLS®) in 2017, a 9.9 per cent decrease from the 39,943 sales recorded in 2016, and a 15 per cent decrease over the 42,326 residential sales in 2015.
Last year’s sales total was, however, 9.7 per cent above the 10-year sales average.
“It was a steady year for home sales across the region, led by condominium and townhome activity, and a quieter year for home listings,” Jill Oudil, REBGV president said. “Metro Vancouver home sales were the third highest we’ve seen in the past ten years while the home listings total was the second lowest on record for the same period.”
Home listings in Metro Vancouver reached 54,655 in 2017. This is a 5.1 per cent decrease compared to the 57,596 homes listed in 2016 and a 4.5 per cent decrease compared to the 57,249 homes listed in 2015.
Last year’s listings total was 4.4 per cent below the 10-year listings average.
“Market activity differed considerably this year based on property type,” Oudil said. “Competition was intense in the condominium and townhome markets, with multiple offer situations becoming commonplace. The detached home market operated in a more balanced state, giving home buyers more selection to choose from and more time to make decisions.”
The MLS® HPI composite benchmark price for all residential properties in Metro Vancouver ends the year at $1,050,300. This is up 15.9 per cent compared to December 2016.
The benchmark price of condominiums increased 25.9 per cent in the region last year. Townhomes increased 18.5 per cent and detached homes increased 7.9 per cent.
“Strong economic growth, low interest rates, declining unemployment, increasing wages and a growing population all helped boost home buyer demand in our region last year,” Oudil said.
December summary
Sales of detached, attached, and apartment properties totalled 2,016 in the region in December 2017, a 17.6 per cent increase from the 1,714 sales recorded in December 2016 and a 27.9 per cent decrease compared to November 2017 when 2,795 homes sold.
Last month’s sales were 7.5 per cent above the 10-year sales average for the month.
“As we move into 2018, REALTORS® are working with their clients to help them understand how changing interest rates and the federal government’s new mortgage qualifications could affect their purchasing power,” Oudil said. “Only time will tell what impact these rules will have on the market.
“Home buyers today should get pre-approved before making an offer to ensure that your home buying goals align with your financial situation,” Oudil said.
There were 1,891 residential homes newly listed for sale in December 2017. This represents a 44.1 per cent increase compared to the 1,312 homes listed in December 2016 and a 54 per cent decrease compared to November 2017 when 4,109 properties were listed.
The total number of homes currently listed for sale on the MLS® in Metro Vancouver is 6,958, a 9.7 per cent increase compared to December 2016 (6,345) and a 20.5 per cent decrease compared to November 2017 (8,747).
The sales-to-active listings ratio for December 2017 is 29 per cent. By property type, the ratio is 14.4 per cent for detached homes, 38.8 per cent for townhomes, and 59.6 per cent for condominiums.
Generally, analysts say that downward pressure on home prices occurs when the ratio dips below the 12 per cent mark for a sustained period, while home prices often experience upward pressure when it surpasses 20 per cent over several months.
Sales of detached properties in December 2017 reached 617, a 14 per cent increase from the 541 detached sales recorded in December 2016. The benchmark price for a detached home in the region is $1,605,800. This represents a 7.9 per cent increase compared to December 2016.
Sales of apartment homes reached 1,028 in December 2017, a 12.3 per cent increase compared to the 915 sales in December 2016.The benchmark price of an apartment in the region is $655,400. This represents a 25.9 per cent increase compared to December 2016.
Attached (or townhome) property sales in December 2017 totalled 371, a 43.8 per cent increase compared to the 258 sales in December 2016. The benchmark price of an attached home in the region is $803,700. This represents an 18.5 per cent increase compared to December 2016.
Do you you have any quesitons on what this could mean for you and your home? Give me a call.

 Your neighbourhood has a lot of features that can help sell your home faster. Unfortunately, buyers don’t usually notice those features just by driving around. So, you need to make sure they get all the information they need about your neighbourhood.